
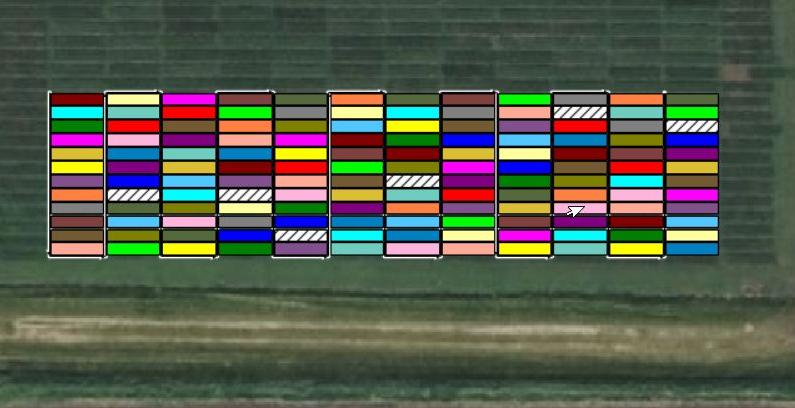
Data tells a story—but maps bring it to life.
Geospatial mapping connects your trial data to real-world field locations using coordinates and GIS technology. Instead of relying on static images or spreadsheets, researchers can now visualize exact plot polygons, layer multiple data sources, and uncover patterns that traditional formats simply can’t show.
Why It Matters:
- Communication: Researchers have the ability to share their plot data, opening the doors for better communication between individuals and systems. For example, the cooperator can now plant around the plot or skip spraying a specific area. They could also have a drone company fly their location.
- Better Understanding: Maps show patterns in soil quality, crop health, yield, and treatment results you can’t see in tables.
- Smarter Decisions: By spotting differences across a field, researchers can plan better trials and recommend more effective practices.
- Faster, More Accurate Work: Mapping helps quickly find problems or successes, making research more efficient and reliable.
What It Can Do:
- Layer Visualization: Combine different data sources (like treatments, soil zones, or imagery) on one map to see the interaction between layers and how they correlate.
- Attribute Management: Click on any area of the map to view detailed information about that specific plot.
- Spatial Selection: Choose plots to analyze based on where they are or what their data shows.
- Trial Comparison: Compare results from different trials, seasons, or locations to see bigger trends.
By using geospatial mapping, researchers get a clearer picture of what’s happening in the field, leading to smarter, more targeted agricultural solutions.